India’s sharp decline in poverty reflects rising consumption, employment and stronger welfare delivery, yet many households remain vulnerable to economic shocks.
UPSC relevance:
|
GS Paper I |
Indian Society — Poverty and Developmental Issues |
|
GS Paper II |
Social Justice — Welfare Schemes, Poverty and Hunger |
|
GS Paper III |
Indian Economy — Inclusive Growth and Employment |
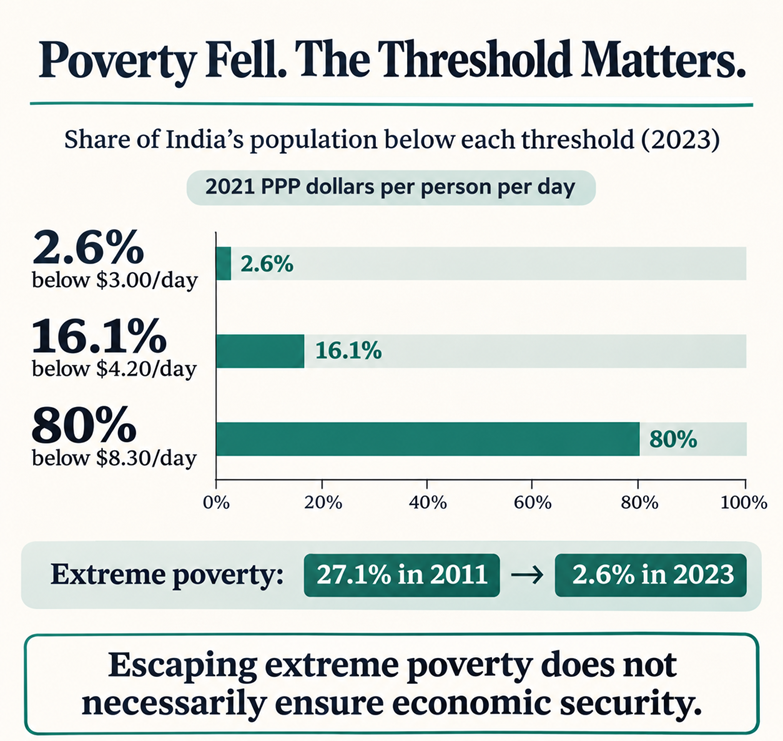
India has made a substantial transition from the 1971 call of “Garibi Hatao” to a sharp reduction in poverty. World Bank figures place extreme poverty at 2.6% in 2023. Nearly 50 crore people crossed the lower-middle-income poverty line between 2011 and 2023. Yet crossing a statistical threshold does not guarantee lasting economic security: vulnerable households can fall back into poverty after illness, crop loss or unemployment.
Understanding the Poverty Lines
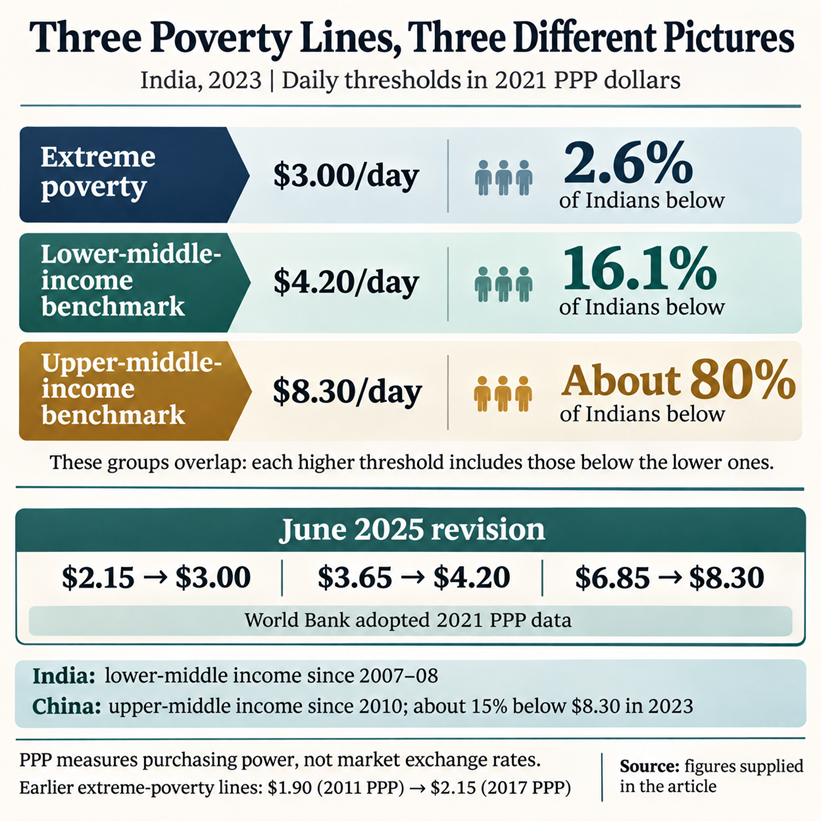
A poverty line is an income or consumption threshold; the headcount ratio measures the share of people below it. Absolute poverty uses a fixed standard of basic needs, while relative poverty is assessed against a share of median income. India and the World Bank use absolute poverty lines. Purchasing power parity (PPP) adjusts currencies for what they can buy; $4.21 PPP is approximately ₹85 a day.
In June 2025, the World Bank adopted 2021 PPP data and revised its daily thresholds: the International Poverty Line rose from $2.15 to $3.00, the lower-middle-income line from $3.65 to $4.20, and the upper-middle-income line from $6.85 to $8.30. Earlier international thresholds included $1.90 in 2011 PPP and $2.15 in 2017 PPP. These are purchasing-power benchmarks, not amounts converted at market exchange rates.
India became a lower-middle-income country in 2007–08, making $4.20 a relevant benchmark. In 2023, 2.6% of Indians were below $3.00, 16.1% below $4.20 and about 80% below $8.30. China became upper-middle income in 2010; approximately 15% of its population was below the $8.30 line. The choice of threshold therefore changes the scale of deprivation being measured.
From Falling Rates to Falling Numbers
For much of the period after Independence, poverty reduction resembled a race to stand still: poverty rates fell, but population growth kept the number of poor rising. At $4.20, the headcount increased from 53.7 crore in 1977 to a peak of 85.3 crore in 2004, although the poverty rate declined from 82.9% to 74.5%. The number subsequently fell, gradually at first and steeply after 2011.
At the $4.20 line, poverty fell from 57.7% or 73.2 crore people in 2011 to 23.9% or 34.2 crore in 2022, and 16.1% or approximately 23 crore in 2023. At $3.00, the corresponding figures were 27.1% or 34.5 crore, 5.3% or 7.5 crore, and 2.6% or 3.7 crore. Extreme poverty had affected 59.7% or 38.7 crore people in 1977 and 46.4% or 53.2 crore in 2004. Thus, approximately 50 crore people left extreme poverty between 2004 and 2023, while a similar number crossed the $4.20 line during 2011–23.
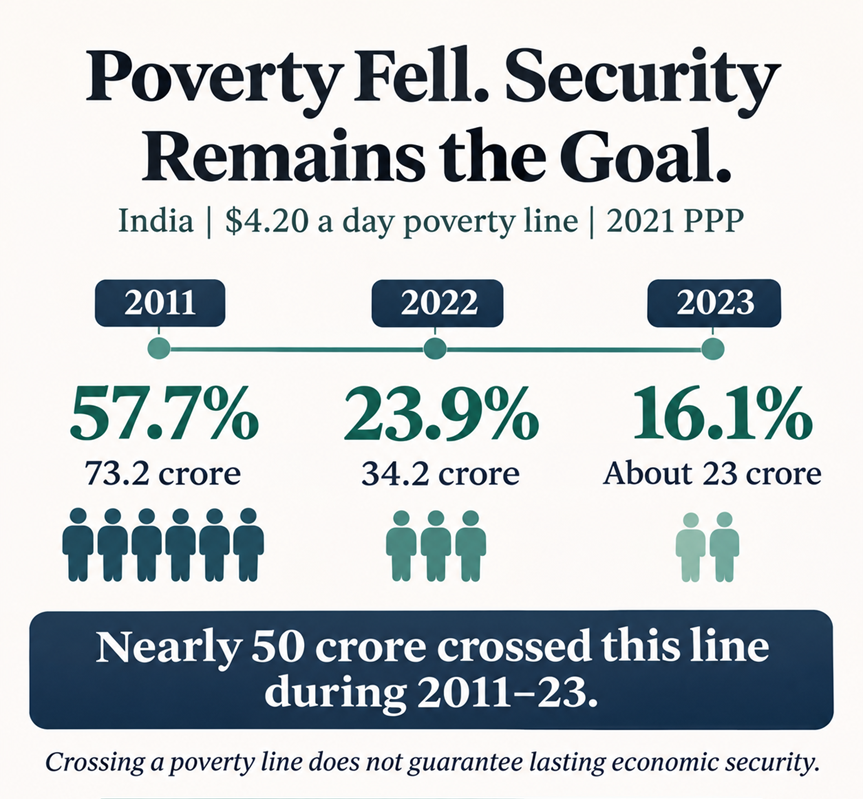
The trajectory has three phases: falling rates but rising numbers up to around 2004; a turnaround during 2004–11 associated with high growth, MGNREGA and rural wages; and the steep decline during 2011–23. In the regional comparison for 2023, Bangladesh recorded poverty rates of 5.9% at $3.00 and 20.5% at $4.20, compared with Pakistan’s 23.0% and 47.9%. Pakistan’s extreme-poverty rate was nearly nine times India’s and four times Bangladesh’s; poverty and its prosperity gap worsened after Covid.
Poverty Beyond Income
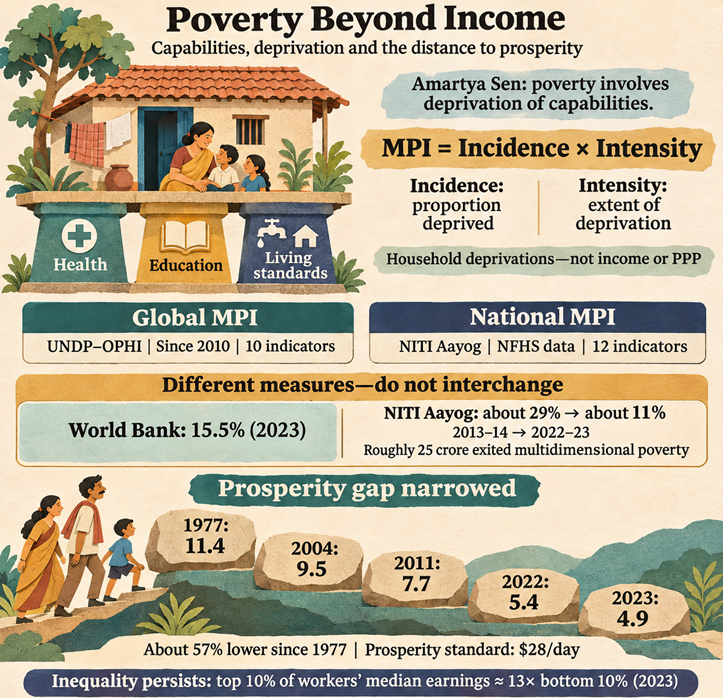
Poverty also involves deprivation of capabilities, as emphasised by Amartya Sen. Multidimensional measures examine health, education and living standards. The Multidimensional Poverty Index combines incidence, or the proportion deprived, with intensity, or the extent of their deprivation. It measures household deprivations rather than income or PPP. The UNDP–OPHI Global MPI, first released in 2010, uses 10 indicators; NITI Aayog’s National MPI uses 12 indicators across three dimensions and draws on NFHS data.
The World Bank multidimensional poverty figure is 15.5% for 2023. NITI Aayog’s estimates indicate a decline from about 29% in 2013–14 to about 11% in 2022–23, with roughly 25 crore people exiting multidimensional poverty. These figures use different methods and should not be treated as interchangeable.
The prosperity gap captures the distance from a global prosperity standard of $28 a day, incorporating the depth and distribution of shortfalls rather than only counting the poor. India’s gap declined from 11.4 in 1977 to 9.5 in 2004, 7.7 in 2011, 5.4 in 2022 and 4.9 in 2023—a fall of about 57% since 1977. Nevertheless, median earnings among the top 10% of workers were approximately 13 times those of the bottom 10% in 2023.
What Helped Reduce Poverty
The World Bank identifies strong consumption growth, rising employment—particularly among rural women—and expanded social transfers, including food subsidies, as major drivers. Financial inclusion and improved delivery through Jan Dhan accounts, the Jan Dhan–Aadhaar–Mobile trinity, Direct Benefit Transfer, public distribution reforms and One Nation One Ration Card helped benefits reach households. Rajiv Gandhi’s 1985 observation that only about 15 paise of every development rupee reached beneficiaries provides the historical context for these delivery reforms.
The social protection floor includes NFSA and PMGKAY food support, MGNREGA employment and PM-KISAN transfers. PMAY, Ujjwala, Jal Jeevan Mission and Swachh Bharat address housing, cooking fuel, water and sanitation deprivation. Rural roads, electrification, self-help groups and the National Rural Livelihoods Mission also support inclusion and livelihoods. However, much of the rise in female employment is rural self-employment, including unpaid or low-paid work, raising concerns about employment quality.
Why Vulnerability Persists
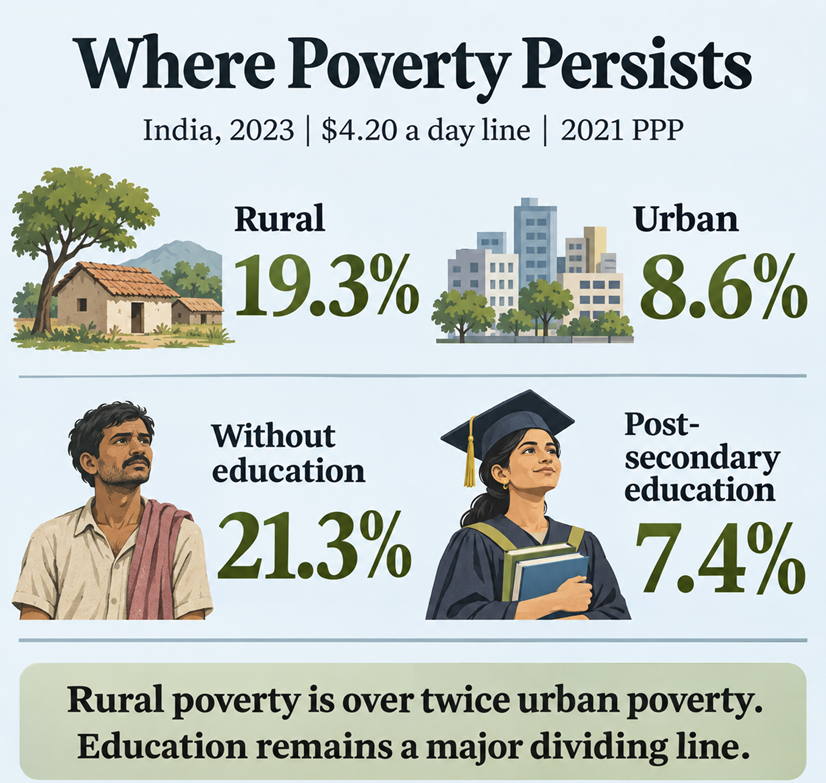
Rural poverty, at 19.3%, was more than twice urban poverty, at 8.6%, in 2023. Poverty among people without education was 21.3%, compared with 7.4% among those with post-secondary education—nearly a threefold difference. More than half of the remaining poor were concentrated in the Uttar Pradesh–Bihar–Bengal belt, showing the importance of regional and educational inequalities.
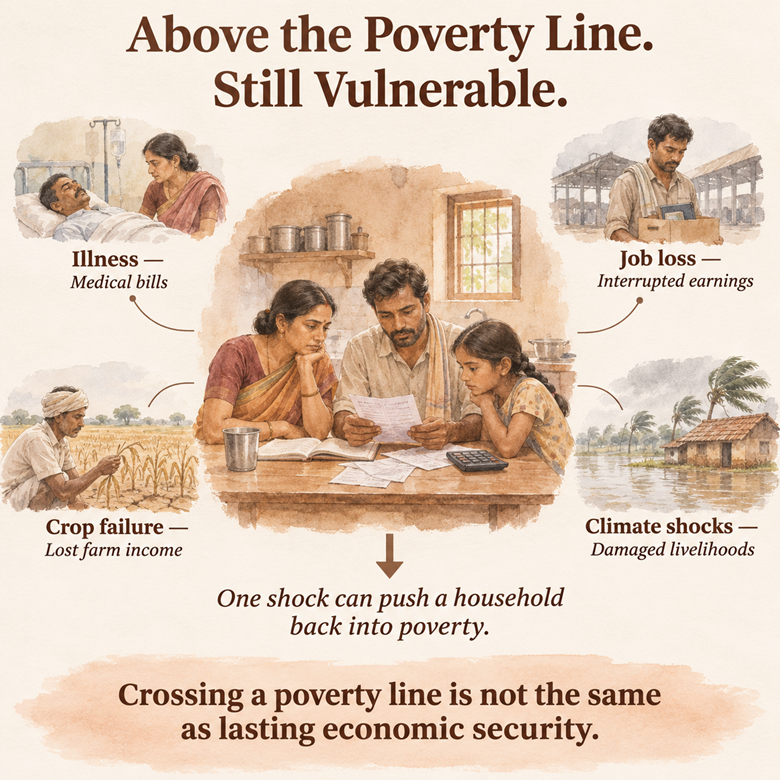
Households just above the poverty line remain exposed to out-of-pocket health expenditure, climate shocks, crop losses and job loss. Approximately 81 crore people receiving free foodgrain indicate the continuing importance of income support and food security. The finding that about 80% remain below the upper-middle-income benchmark shows the distance between escaping extreme poverty and attaining a secure middle-class standard of living.
Measurement also matters. India’s poverty-estimation approaches evolved through the Alagh Committee in 1979, based on calorie norms; Lakdawala in 1993, with state-specific lines; Tendulkar in 2009; and Rangarajan in 2014. For 2011–12, Tendulkar estimated poverty at 21.9%, against Rangarajan’s approximately 29.5%. The last official national estimate remains based on 2011–12 and the Tendulkar method. HCES 2022–23 and 2023–24 introduced improved consumption recall methods. The World Bank notes that part of the recent decline may reflect better measurement as well as improved living conditions.
Turning Poverty Reduction into Lasting Security
The next stage requires labour-intensive manufacturing, services and MSMEs to translate growth into productive jobs and wages. Education, learning outcomes, nutrition and skills must strengthen earning capacity. Graduation approaches, including the BRAC model, can combine livelihood support, skills and credit to help households move towards sustained self-reliance.
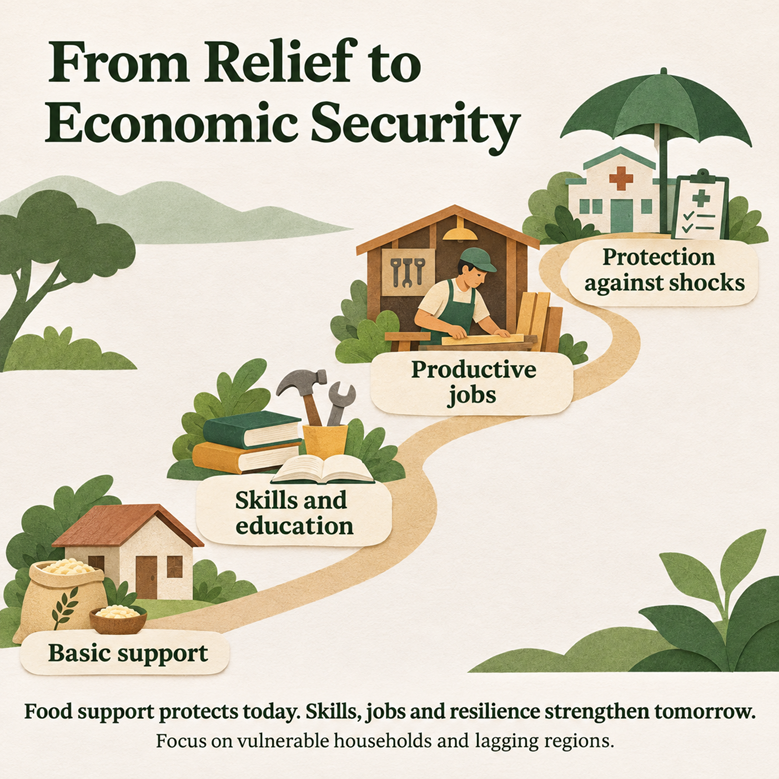
Protection against shocks requires health coverage through Ayushman Bharat, crop insurance, urban social security and portable benefits for migrants. The Aspirational Districts approach can focus attention on lagging regions, particularly the eastern belt. A new official national poverty line using HCES data, alongside measures of multidimensional deprivation and vulnerability, would improve monitoring.
Ambedkar’s 1949 warning about political equality coexisting with social and economic inequality remains relevant. India’s task is to convert a historic reduction in poverty into durable economic security, advancing SDG 1 on poverty, SDG 2 on hunger and the aspiration of Viksit Bharat by 2047.
Also read today's article on:
Animal Testing and the Shift Towards Human Relevant Science