The article examines India’s surge in Geographical Indication (GI) registrations and the concentration of authorised user applications in a few regions and sectors.
UPSC Relevance
|
UPSC paper |
Subject |
|
GS Paper III |
Intellectual Property Rights, Agriculture and Economy |
|
GS Paper I |
Indian Art and Culture |
|
GS Paper II |
Government Policies and Interventions |
India has thousands of region – specific products, with growing efforts to secure geographical Indication (GI) tags, or geographical origin branding. While some have found success, many remain unapped opportunities.
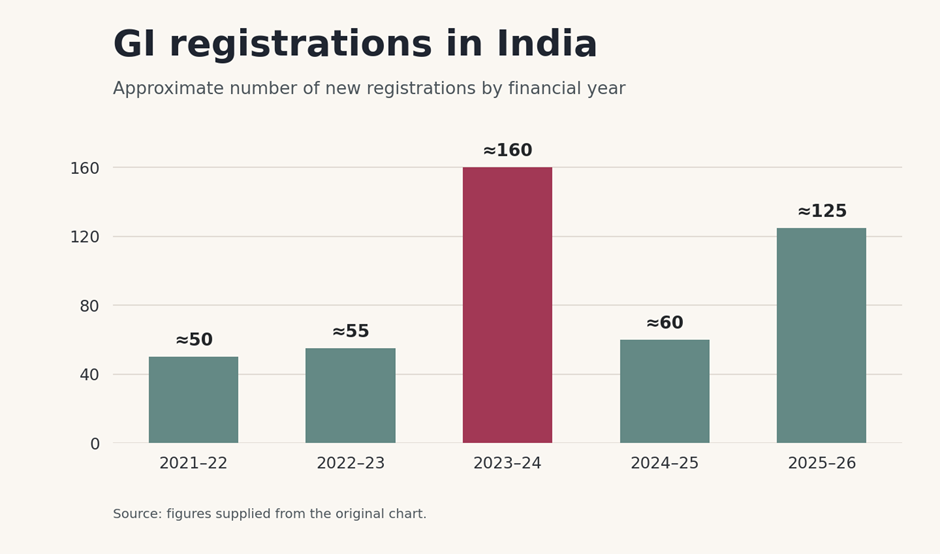
GI Registrations in India Have Risen Sharply in Recent Years
A Geographical Indication (GI) is an intellectual property sign used on goods whose quality, characteristics or reputation are essentially attributable to their place of origin.
The chart tracks annual GI registrations in India from 2004–05 to 2025–26. Registrations stayed below 50 in most years before 2021–22, then rose sharply. They peaked at around 160 in 2023–24, fell to about 60 in 2024–25 and rebounded to roughly 125 in 2025–26.
|
Financial year |
Approximate GI registrations |
|
2021–22 |
50 |
|
2022–23 |
55 |
|
2023–24 |
160 |
|
2024–25 |
60 |
|
2025–26 |
125 |
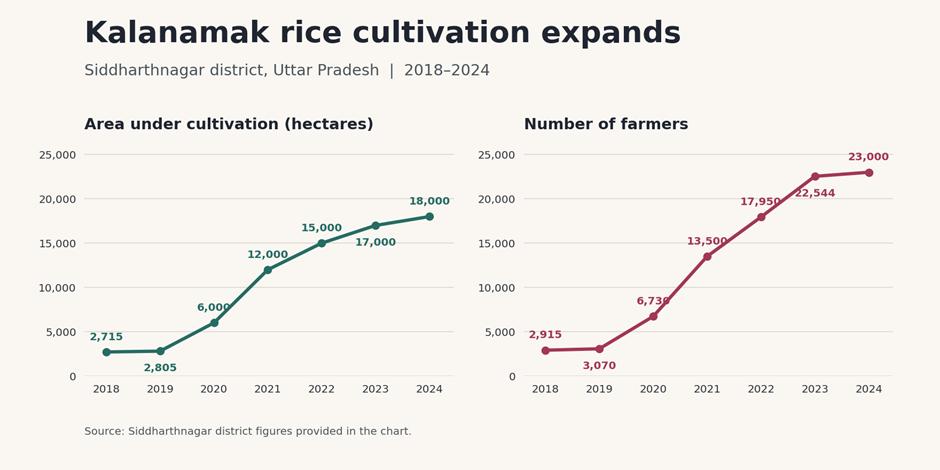
Kalanamak Rice Cultivation Expands in Siddharthnagar, Uttar Pradesh
Between 2018 and 2024, the area under Kalanamak rice cultivation in Siddharthnagar district rose from 2,715 to 18,000 hectares, or about 6.6 times its 2018 level. The number of farmers growing the variety rose from 2,915 to 23,000, nearly eightfold. The chart begins in 2018, five years after Kalanamak rice received its Geographical Indication (GI) tag.
|
Year |
Area under cultivation (hectares) |
Number of farmers |
|
2018 |
2,715 |
2,915 |
|
2019 |
2,805 |
3,070 |
|
2020 |
6,000 |
6,730 |
|
2021 |
12,000 |
13,500 |
|
2022 |
15,000 |
17,950 |
|
2023 |
17,000 |
22,544 |
|
2024 |
18,000 |
23,000 |

Nearly Three in Four GI Registrations Are in Crafts or Agriculture
Of the 822 Geographical Indications (GIs) covered by the chart, 607 (73.8%) are for handicrafts and artisan products or agricultural and horticultural goods. Handicrafts and artisan products form the largest category with 350 registrations (42.6%), followed by agricultural and horticultural goods with 257 (31.3%).
|
Sector |
GI registrations |
|
Handicrafts and artisan products |
350 |
|
Agricultural and horticultural goods |
257 |
|
Textiles and fabrics |
85 |
|
Foods and beverages |
61 |
|
Manufactured goods |
38 |
|
Alcoholic beverages |
19 |
|
Others |
12 |
|
Total |
822 |
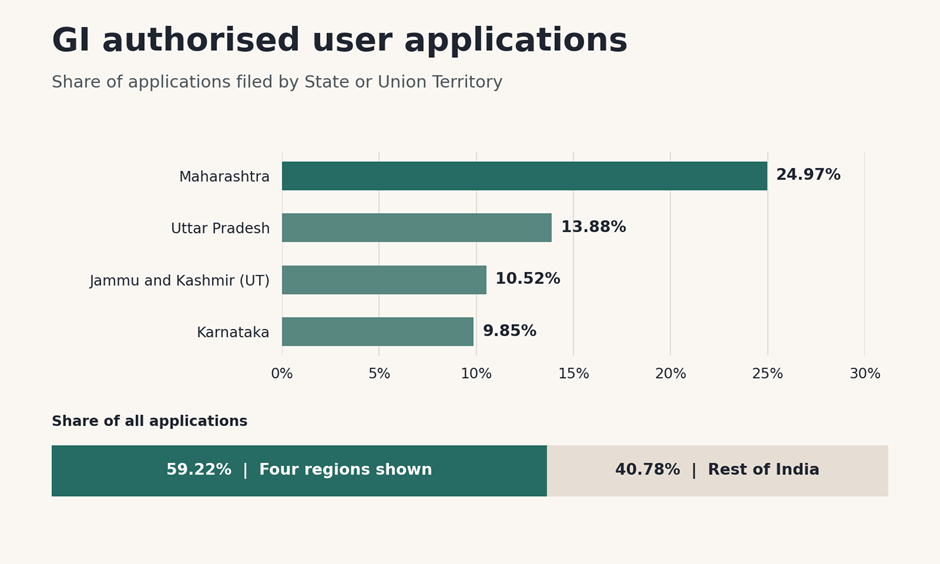
Three States and One Union Territory Account for About 60% of GI Authorised User Applications
Maharashtra accounts for nearly one in four applications for authorised user status linked to Geographical Indications (GIs). Together, Maharashtra, Uttar Pradesh, Jammu and Kashmir, and Karnataka account for 59.22% of the applications shown in the chart.
|
State or Union Territory |
Share of GI authorised user applications |
|
Maharashtra |
24.97% |
|
Uttar Pradesh |
13.88% |
|
Jammu and Kashmir (Union Territory) |
10.52% |
|
Karnataka |
9.85% |
|
Combined share |
59.22% |
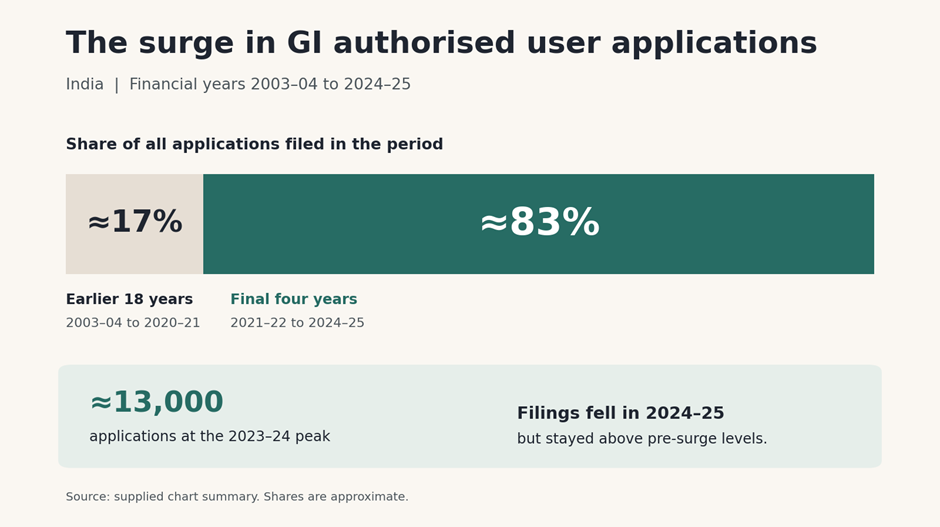
About 83% of GI Authorised User Applications Were Filed in Four Years
The chart tracks applications for Geographical Indication (GI) authorised user status in India from 2003–04 to 2024–25. Annual filings remained relatively low for most of the period, then rose sharply from 2021–22. About 83% of all applications recorded in the chart were filed in its final four financial years, from 2021–22 to 2024–25.
Annual filings peaked at around 13,000 in 2023–24. They fell in 2024–25 but remained well above the levels recorded before the surge.
Geographical Indication (GI), a form of intellectual property used on products that have a specific geographical origin and possess qualities, characteristics or a reputation essentially attributable to that place. The good thing about a GI tag is that unlike a trademark, which enables private ownership, it is the collective right of people living in an area following traditional production methods and quality practices associated with a product. Once a GI is issued for a product—say, Kancheepuram silk—any producer who follows the same production process can apply to get a GI tag for their output. For customers, a GI tag is akin to branding to identify a genuine product.
It is a concept that could greatly benefit India, a country with diverse cultures and unique products. Think Darjeeling tea, Chanderi saris, Pochampally Ikat, Madhubani paintings and Khurja pottery. All have been assigned GI tags by a designated Indian government body.
Globally also, for example , Champagne is best known as a sparkling wine. It is also the name of a region about 150 km east of Paris, where the drink originated. The region is an early success story in geographical branding. Producing champagne requires specific vineyard practices, sourcing grapes only from designated areas, and following prescribed grape-pressing and fermentation methods. The region is estimated to generate annual revenues of about €6 billion from champagne production.
INDIAN SCENERIO
India started issuing GI tags in 2004-05, with Darjeeling tea, Pochampally Ikat and Chanderi saris being the first three. For the next 16 years until 2020-21, the first year of the covid-19 pandemic, an average of 23 GI tags were issued per year. Thereafter, awareness about the power of GI tags increased, and registrations took off. In the last five financial years, India has issued 452 GI registrations compared to 109 registrations in the previous five-year period.
Of the 822 GI tags issued until March 2026, 350 related to handicrafts and artisan products, and 257 to agriculture and horticulture, representing three-fourths of the total.
It has supported pre- and post-GI registration of 300 products, of which 138 products have been GI-registered, as per Nabard’s impact report for 2024-25.
In the post-covid period, India has seen a surge in registration of both new GI tags, and producers thereof. While this increase is currently concentrated in certain sectors and states, recent evidence related to Kalanamak rice shows that its possible to successfully revive a traditional product for greater employment and income.

Even within the current GI tags, there is potential to be unlocked, along the lines of Kalanamak rice. At present, there is a also large skew in authorized user applications, both in terms of GI tags and states. Of the 822 GI tags issued, the top 10 GI tags accounted for 40% and top 20 for 57% of authorized user applications. These were led by Alphonso mango (1,824 applications), Solapur pomegranate (1,766) and Sangli raisins (1,639).
Similarly, just four states—Maharashtra, Uttar Pradesh, Karnataka, and Jammu and Kashmir—account for 59% of all authorized user applications.
States with a high percentage of tribal population like Chhattisgarh and Jharkhand—who have a trove of unique arts, crafts, products and practices—are fairly behind. For a country hungry for growth and employment levers, there is much in the GI space to unlock.

The current skew toward agricultural products and handicrafts does not do justice to diversity that is India, and suggests an untapped potential. Data availability on the financial potential or impact of GI tags is sketchy—there are no complete revenue, employment or export numbers available. But there are examples that show how a GI tag can shape an ecosystem, with a multiplier effect on employment, livelihoods and revenues.
Nabard estimates its GI interventions have directly or indirectly benefited about 4 million artisans, weavers and farmers, of whom 35% are women.