The article traces how stubble burning adds to pollution before the festival and winter conditions keep pollutants close to the ground.
UPSC relevance:
|
UPSC Paper |
Relevant Subjects and Topics |
|
Mains – GS Paper III (Primary) |
Environment — Urban air pollution, firecracker emissions, stubble burning, air-quality monitoring and gaps in pollution data |
|
Mains – GS Paper I |
Geography — Winter meteorology, temperature inversion and the dispersal of pollutants |
|
Mains – GS Paper II |
Governance and Public Health — Enforcement of pollution-control measures, coordination across jurisdictions and public health impacts |
Air quality deteriorated sharply after Diwali in more than 200 cities, particularly across northern and central India. Delhi and its surrounding areas experienced dense smog and reduced visibility. Gaps in readings at some monitoring stations during the episode raised concerns about data reliability.
Stubble burning had already increased pollution levels before Diwali. As winter sets in, cold air near the ground limits the dispersal of pollutants, allowing poor air quality to persist beyond the festival.
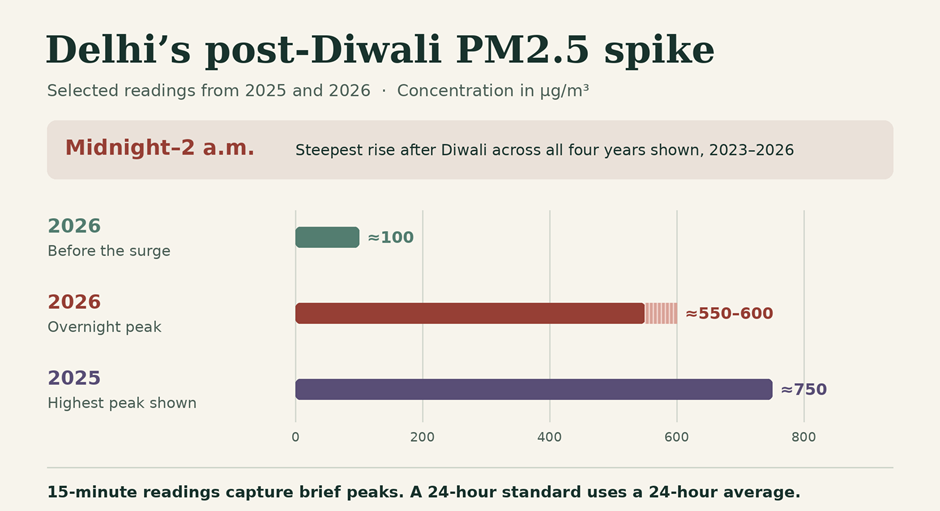
Delhi recorded a sharp spike in PM2.5 concentrations after Diwali celebrations in each of the four years shown, from 2023 to 2026. The steepest rise occurred around midnight to 2 a.m. In 2026, PM2.5 rose from roughly 100 micrograms per cubic metre (µg/m³) in the hours before the surge to around 550–600 µg/m³ at its peak. The highest peak shown was in 2025, when concentrations approached 750 µg/m³.
An overnight spike on top of existing pollution
PM2.5 concentrations fluctuated even before Diwali, showing that Delhi already had a pollution burden before the overnight surge. Concentrations fell sharply after the peak. The repeated timing across all four years shows a consistent post-Diwali spike. Estimating the contribution of firecrackers and other pollution sources would require separate source data.
How to interpret the readings
PM2.5 refers to fine airborne particles with a diameter of 2.5 micrometres or less. The chart shows concentrations at 15-minute intervals, averaged using available readings from 59 air-quality monitoring stations in Delhi. These short-interval readings capture brief peaks. A comparison with a 24-hour air-quality standard requires a 24-hour average.
Delhi’s Recurring Post-Diwali Pollution Spike
15-minute Central Pollution Control Board (CPCB) readings from 59 monitoring stations found that Delhi’s PM2.5 levels began rising around 5 p.m. on Diwali and surged five- to sevenfold within hours, reaching 500–700 µg/m³ between midnight and 2 a.m. PM2.5 consists of fine particles that can penetrate deep into the lungs.
The spike recurred each year from 2023 to 2026. Pollution reached particularly high levels in 2025 and 2026 despite restrictions limiting firecracker use to certified green crackers during specified hours. The recurring overnight surge highlights gaps in pollution control during the festival.
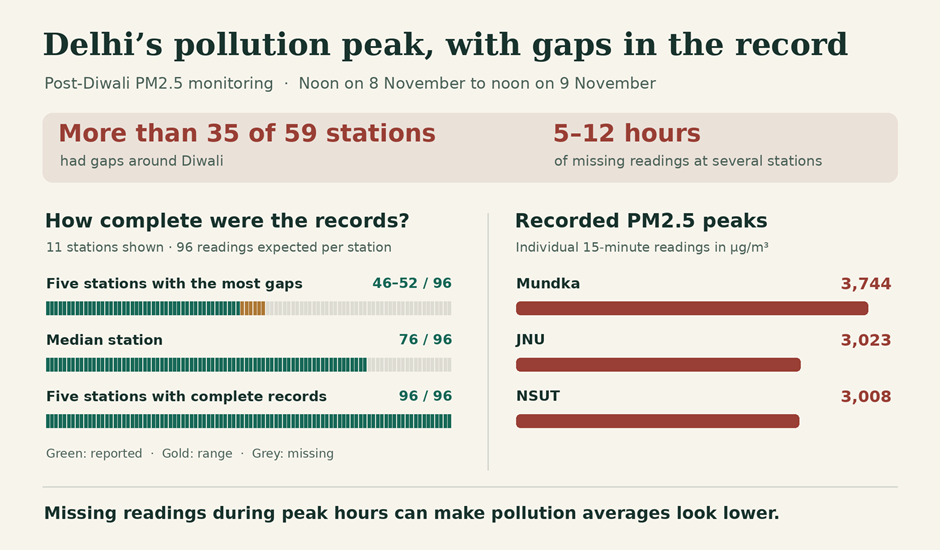
More than 35 of Delhi’s 59 air quality monitoring stations had gaps in their PM2.5 records around Diwali. At several stations, readings were missing for 5–12 hours during the period when pollution peaked after the celebrations. These gaps make it harder to determine how high pollution rose and how long the peak lasted.
How much data was missing?
11 monitoring stations over a 24-hour period from noon on 8 November to noon on 9 November. Each station was expected to record 96 readings at 15-minute intervals. The five stations with the most gaps reported only 46–52 readings each, the median station reported 76, and the five stations with complete records reported all 96. The groups are ranked by data completeness.
Why the gaps matter
Among the recorded post-Diwali peaks, PM2.5 reached 3,744 µg/m³ at Mundka, 3,023 µg/m³ at JNU, and 3,008 µg/m³ at NSUT. These were 15-minute readings at individual stations. If readings go missing during the most polluted hours, an average based on the available data can understate the severity of the episode. Reporting how many readings were available alongside the pollution figures helps readers judge how representative the averages are.
Gaps in Delhi’s Post-Diwali Air Pollution Data
22% of Delhi’s 15-minute PM2.5 readings were missing between noon on 8 November and noon on 9 November, up from 14% three years earlier. Only 4,439 of 5,664 expected readings were available. The gaps affected at least 35 monitoring stations and clustered around midnight, when pollution surged. Possible reasons include sensors reaching their 1,000 µg/m³ measurement limit and clogged filter tapes triggering automatic shut-offs.
Separate Delhi Pollution Control Committee (DPCC) data recorded a peak of 3,744 µg/m³ at Mundka around 2 a.m. on 9 November. Eleven of 30 stations recorded readings above 2,000 µg/m³. When readings are missing during peak hours, averages based on available data can understate the severity of pollution.
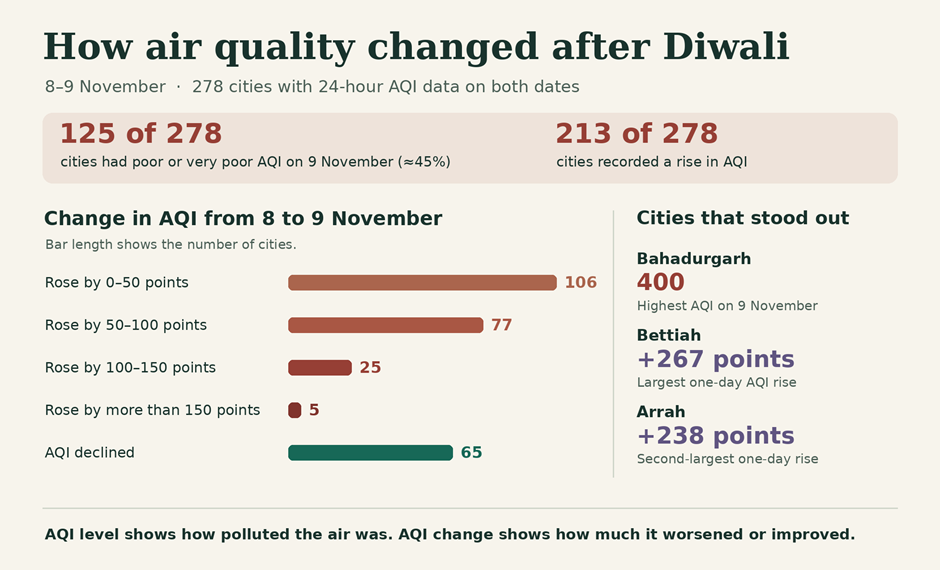
125 of the 278 cities covered by the chart recorded poor or very poor air quality. This was about 45% of the cities assessed. The Air Quality Index (AQI) rose in 213 cities and declined in 65. A higher AQI indicates worse air quality.
Where was the deterioration greatest?
Bahadurgarh recorded the highest AQI at 400. Bettiah recorded the largest day-to-day increase, at 267 points, followed by Arrah, at 238 points. The final AQI shows how polluted the air was, while the change in AQI shows how sharply conditions worsened from the previous day.
|
Change in AQI from 8 to 9 November |
Number of cities |
|
Increase of 0–50 points |
106 |
|
Increase of 50–100 points |
77 |
|
Increase of 100–150 points |
25 |
|
Increase of more than 150 points |
5 |
|
AQI declined |
65 |
|
Total |
278 |
The comparison covers cities with data available for both dates and uses 24-hour averages. It captures how widely air quality deteriorated after Diwali. Estimating the contribution of individual pollution sources would require separate emissions and weather data.
Post-Diwali Air Quality Worsened Across Indian Cities
The number of cities with moderate or worse air quality rose from 191 on Diwali to 246 the following day. Of the 278 cities with Air Quality Index (AQI) data for both 8 and 9 November, 213 recorded an increase, including 30 where AQI rose by more than 100 points.
Bahadurgarh, Haryana, recorded the highest 24-hour AQI on 9 November, at 400. Bettiah and Arrah in Bihar saw the largest increases, both exceeding 200 points, and moved into the poor category. Overall, 51 cities slipped from good or satisfactory air quality to moderate or poor.
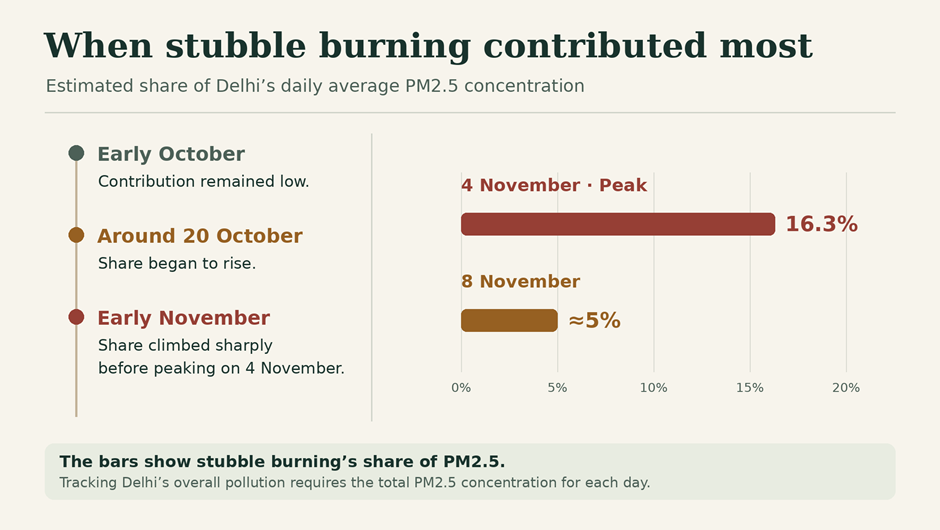
Stubble burning’s estimated share of Delhi’s daily average PM2.5 concentration peaked at 16.3% on 4 November. Its contribution was low in early October, began rising around 20 October, and fluctuated before climbing sharply in early November. By 8 November, it had fallen to roughly 5%.
Why the timing matters
Stubble burning, the practice of setting fire to crop residue after harvest, added to Delhi’s pollution burden in the days leading up to Diwali. Its effect is especially important when weather conditions limit the dispersal of pollutants. The rise and fall in its daily contribution show why a seasonal average can obscure the impact on particular days.
The 16.3% figure represents the estimated share of Delhi’s PM2.5 attributable to stubble burning on 4 November. The chart tracks how that share changed from day to day. Assessing whether Delhi’s overall PM2.5 levels also rose or fell requires the total concentration for each day.
Stubble Burning and Delhi’s Pre-Diwali Pollution Build-up
Delhi’s air quality was already very poor before Diwali. Cold air limited the dispersal of pollutants, while stubble burning added to the pollution load. According to the Indian Institute of Tropical Meteorology (IITM), stubble burning’s contribution to Delhi’s PM2.5 began rising around 20 October, reached 16.3% on 4 November, and fell to 5% on 8 November.
A study in Atmospheric Chemistry and Physics estimated that open burning accounted for 8% of India’s annual PM2.5 in 2022, compared with 18% from industry and 15–16% each from residential sources and power generation. The annual national estimate covers open burning broadly, while the Delhi figures show how stubble burning’s contribution can rise sharply during October–November, when weather conditions limit pollutant dispersal.
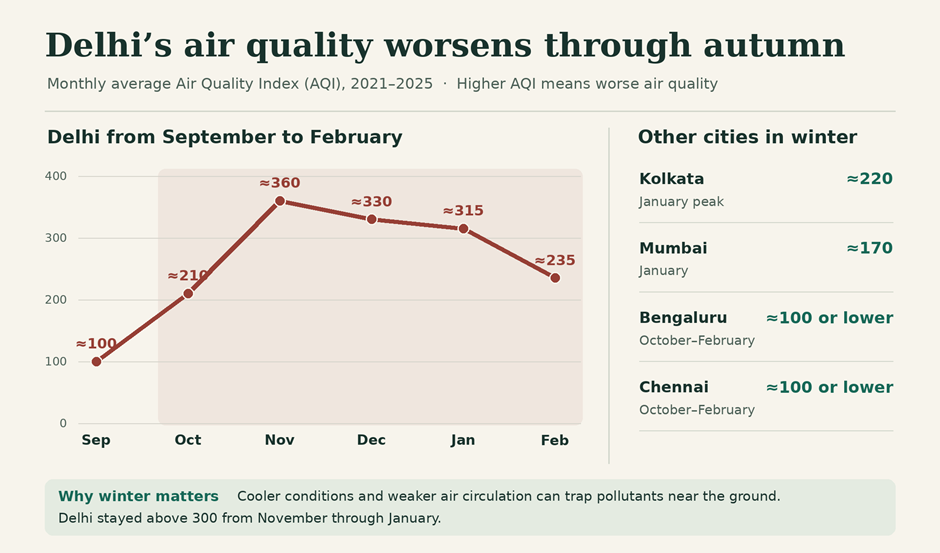
Monthly average Air Quality Index (AQI) data for 2021–2025 show a clear seasonal pattern across five major Indian cities. Delhi recorded the sharpest winter deterioration. Its average AQI rose from around 100 in September to just above 200 in October, peaked at around 360 in November, and remained above 300 in December and January. It eased to around 235 in February. A higher AQI indicates worse air quality.
How other cities compare
Kolkata also experienced a winter rise, with its average AQI peaking at around 220 in January. Mumbai saw a smaller increase, reaching roughly 170 in January. Bengaluru and Chennai stayed around or below 100 during the winter months shown. The five cities’ readings were closer together during July–September, when Delhi also recorded some of its lowest monthly averages.
Why the seasonal pattern matters
Cooler conditions and weaker air circulation can limit the dispersal of pollutants, allowing them to accumulate near the ground. Delhi’s elevated AQI from October through February shows that poor air quality persists across several months. The chart captures the timing and scale of this deterioration. Estimating how much individual sources contributed would require separate data.
Winter Air Pollution in Indian Cities
Air quality begins to deteriorate in October and remains worse through February. Between 2021 and 2025, Delhi, Mumbai, Chennai and Bengaluru each recorded a higher average Air Quality Index (AQI) in the 10 days after Diwali than in the 10 days before it.
Delhi’s monthly average AQI peaked in November, while Chennai’s peaked in December and those of Kolkata and Mumbai in January. Firecracker emissions and stubble burning add to the pollution load as colder winter conditions limit the dispersal of pollutants near the ground. Delhi’s monthly average AQI was satisfactory for only two months of the year, both during the monsoon.