Index of Eight Core Industries (ICI) – May 2026 highlights Indias industrial performance through coal, crude oil, natural gas, refinery products, fertilizers, steel, cement, and electricity, serving as a key indicator of economic growth
Syllabus Areas:
GS III - Economy
The Index of Eight Core Industries (ICI) increased by 0.5% (provisional) in May 2026 compared to May 2025. This is lower than the 1.8% growth recorded in April 2026. Indicates a slowdown in industrial momentum.
During April–May 2026-27, the cumulative growth of the core sector was 1.1% compared to the same period last year.
What is the Index of Eight Core Industries (ICI)?
The ICI measures the production performance of India's eight fundamental industries.
These industries are called core industries because they provide essential inputs to almost every other sector of the economy.
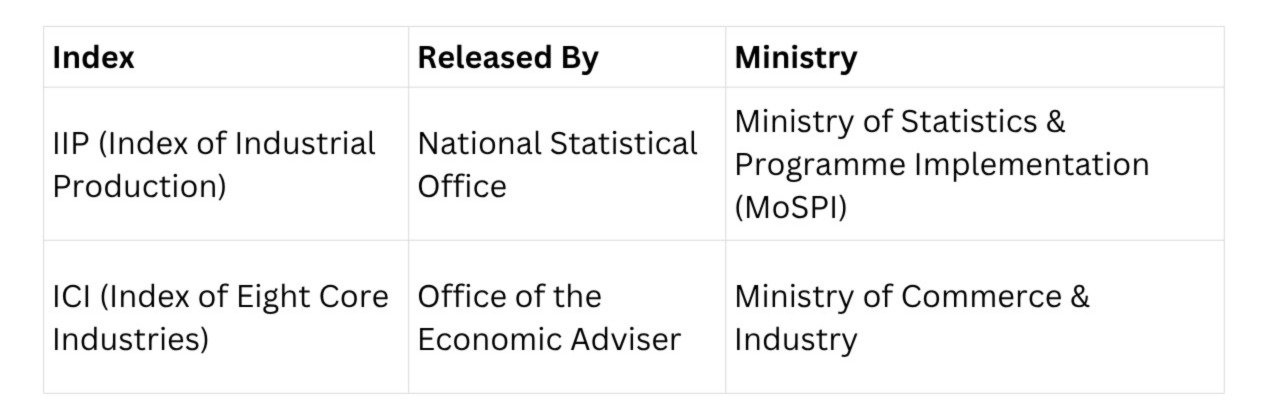
The Index of Eight Core Industries (ICI) is compiled and released by the Office of the Economic Adviser under the Department for Promotion of Industry and Internal Trade (DPIIT), Ministry of Commerce & Industry.
Examples:
-
Steel is needed for construction.
-
Electricity powers industries.
-
Coal fuels thermal power plants.
-
Cement is needed for infrastructure.
Thus, their performance reflects the overall health of the industrial economy.
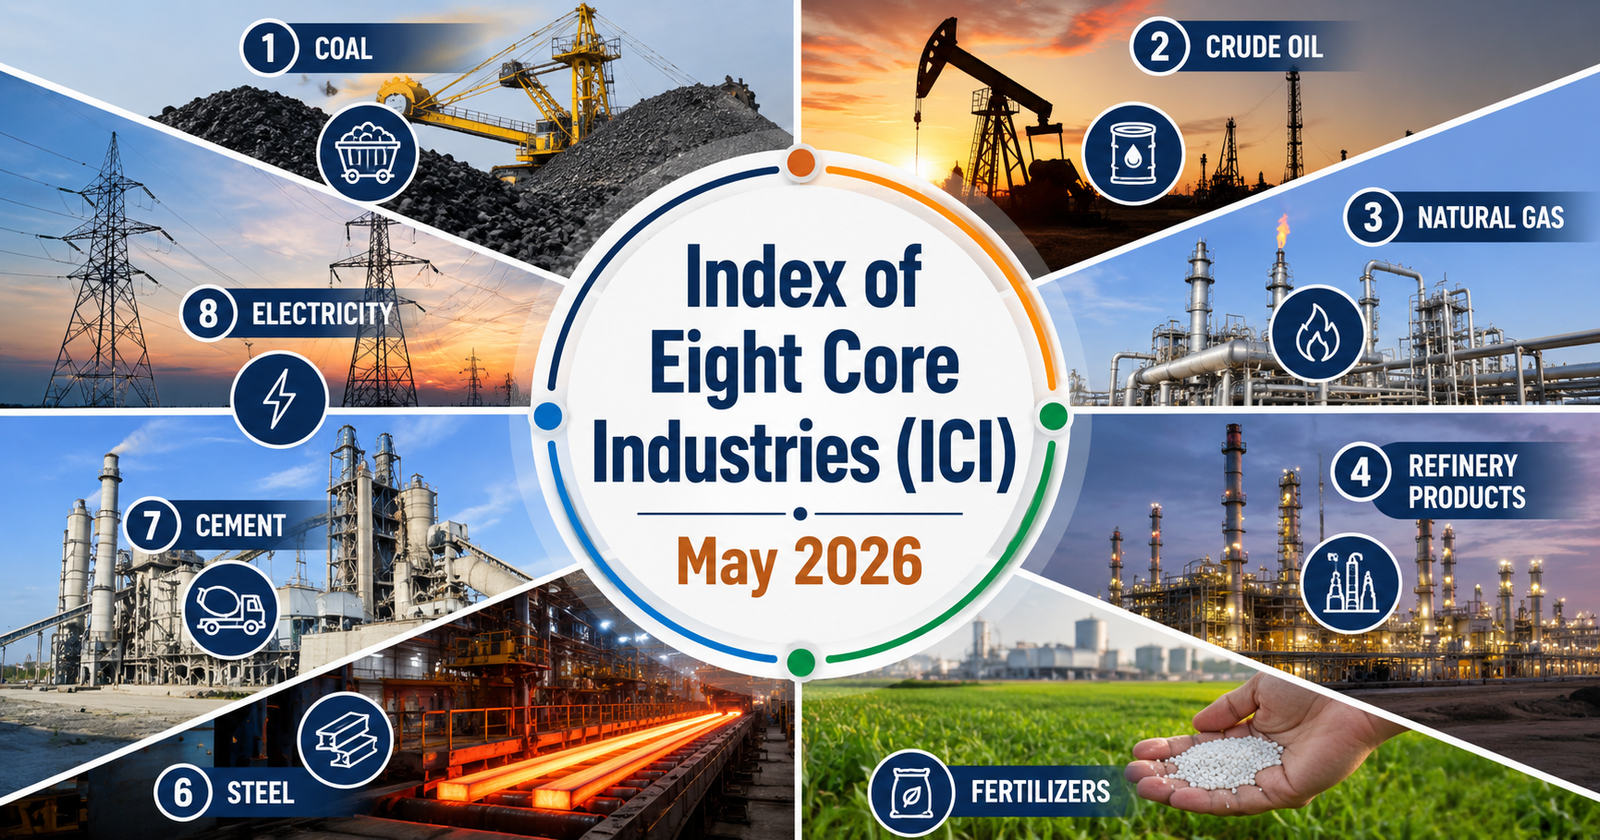
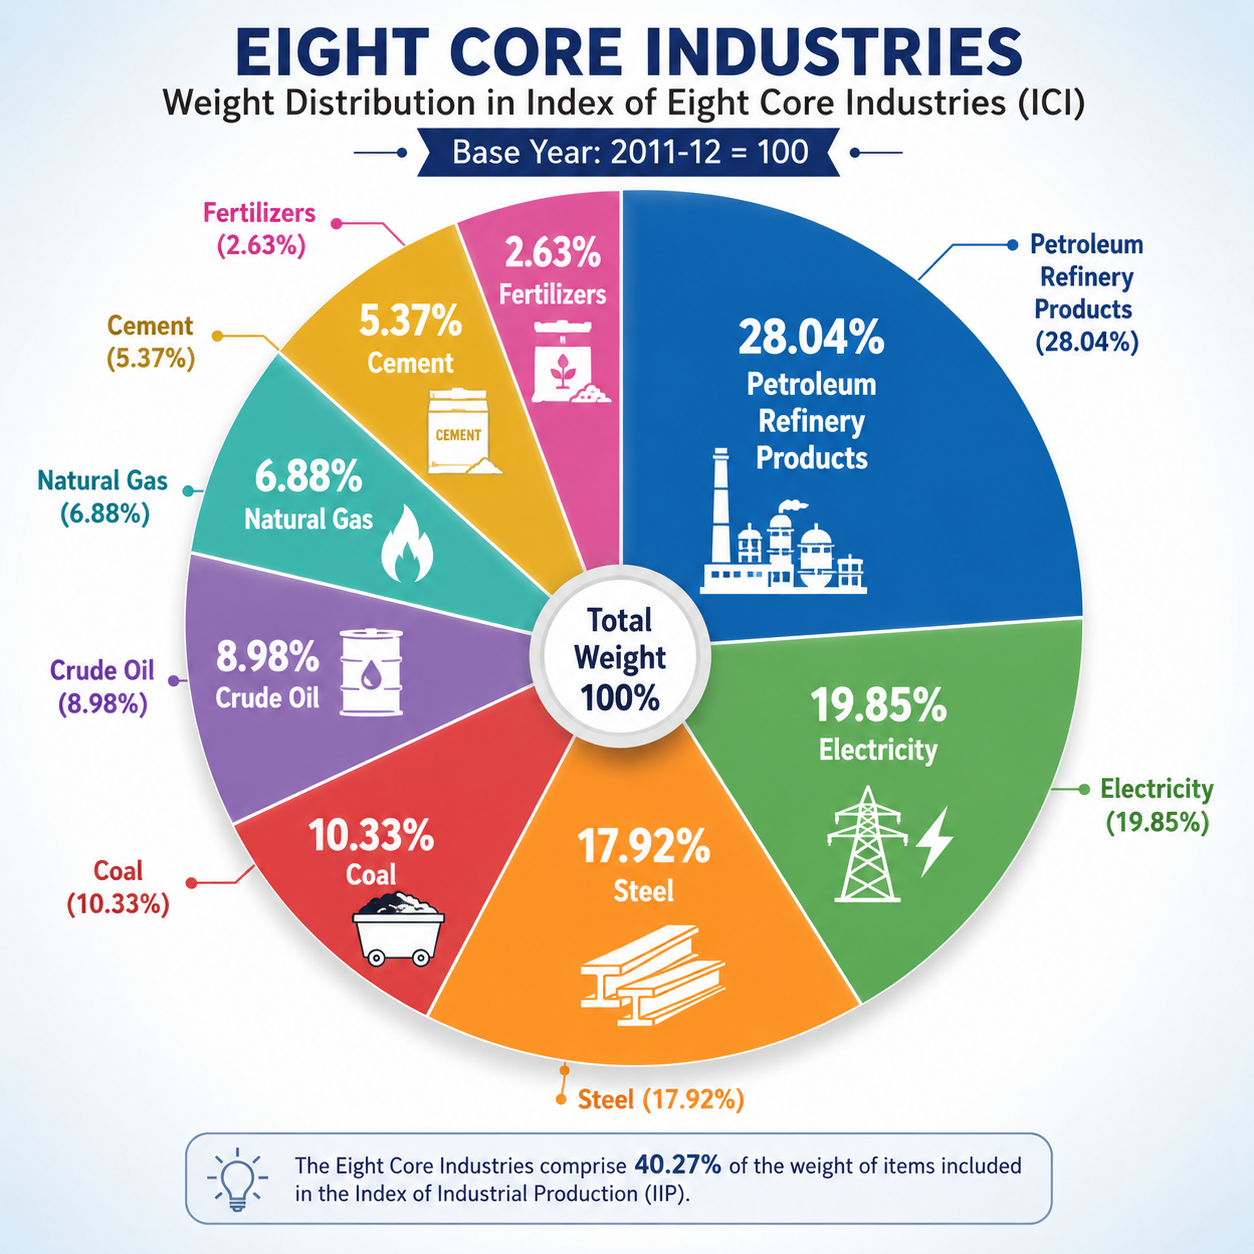
The ICI measures the combined and individual performance of production of eight core industries viz. Coal, Crude Oil, Natural Gas, Refinery Products, Fertilizers, Steel, Cement and Electricity. The Eight Core Industries comprise 40.27 percent of the weight of items included in the Index of Industrial Production (IIP).
What is the Index of Industrial Production?
The Index of Industrial Production (IIP) is a statistical indicator that measures the short-term changes in the volume of production of industrial products in India.
It acts as a barometer of industrial growth and shows whether industrial activity is expanding or slowing down.
Definition: IIP measures the growth rate of various industry groups in the economy over a given period compared to a base year. It is released every month by the: National Statistical Office
Why is IIP Important?
1. Economic Health Indicator
-
Shows the performance of India's industrial sector.
-
Used to assess economic growth trends.
2. Policy Making
-
RBI uses IIP data while formulating monetary policy.
-
Government uses it for industrial planning.
3. Leading Indicator
-
Provides an early signal about GDP growth.
4. Investment Decisions
-
Investors and businesses track IIP to understand economic conditions.
Difference Between IIP and ICI
Sector-wise Performance (May 2026)
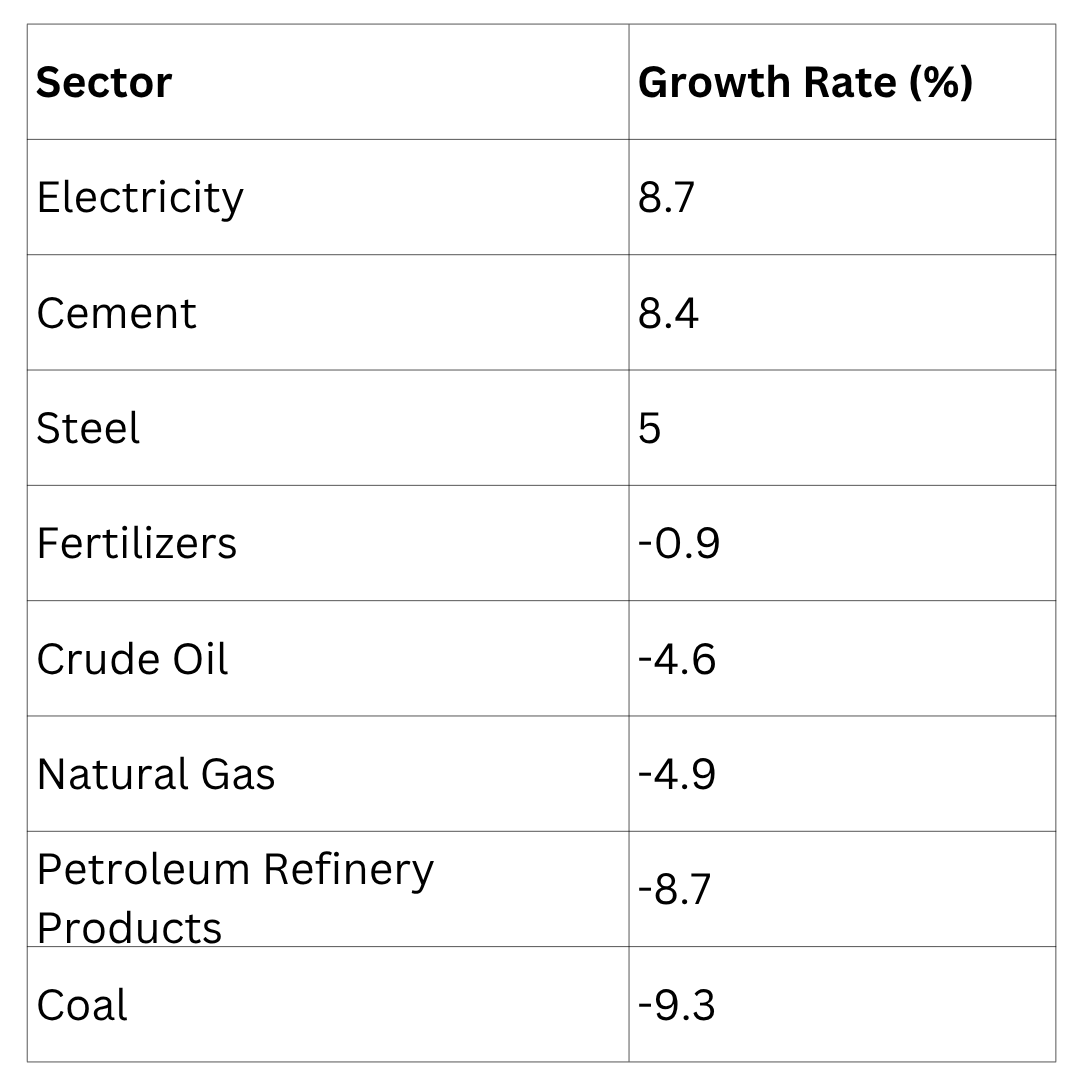
Positives:
Growth in Electricity, Cement, and Steel points to:
-
Strong infrastructure development.
-
Expanding manufacturing activity.
-
Urban development and construction growth.
-
Healthy industrial demand.
Negatives:
Decline in Coal, Crude Oil, Natural Gas, and Refinery Products indicates:
-
Weakness in domestic energy production.
-
Continued energy security challenges.
-
Greater dependence on imported fuels.
The May 2026 Core Industries data indicates that India's economy is being driven by strong infrastructure and manufacturing activity, as reflected in the growth of electricity, cement, and steel. However, the decline in coal, crude oil, natural gas, and refinery products highlights persistent challenges in the energy sector and the need to strengthen domestic energy production for sustainable growth.
Prelims Questions:
1. Which of the following releases the Index of Eight Core Industries (ICI)?
A) Office of the Economic Adviser, DPIIT, Ministry of Commerce & Industry
B) National Statistical Office (NSO), Ministry of Statistics and Programme Implementation
C) Office of the Chief Economic Adviser, Department of Economic Affairs, Ministry of Finance
D) Office of the Chief Economic Adviser, DPIIT, Ministry of Commerce & Industry
Answer: A
2. Arrange the following core industries in descending order of weight:
-
Electricity
-
Steel
-
Coal
-
Petroleum Refinery Products
A) 4–1–2–3
B) 4–2–1–3
C) 1–4–2–3
D) 4–1–3–2
Answer: A