The Illusion of Equality
Syllabus Areas:
GS I - Indian Society (Inequalities in India)
GS III - Economy (Inequalities)
The World Bank's report states India's Gini coefficient of consumption inequality fell from 0.288 in 2011–12 to 0.255 in 2022–23, showing reduced inequality. But experts say this is only consumption inequality, not income or wealth inequality.
Gini Coefficient:
The Gini Coefficient (also called the Gini Index or Gini Ratio) is a statistical measure of inequality in a population, typically used to gauge income or wealth distribution.
- Range: 0 to 1
- 0 = Perfect equality (everyone has the same income)
- 1 = Perfect inequality (few people have all the income, large people have none)
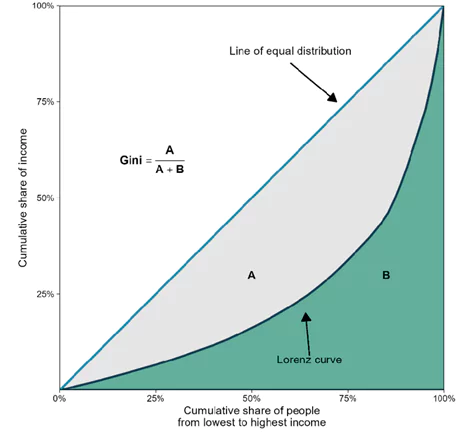
- Formula (simplified):
G = A / (A+B) - Where:
- A = Area between the line of equality and the Lorenz curve
- B = Area under the Lorenz curve
Lorenz Curve:
- The Lorenz Curve is a graphical representation of income or wealth distribution in a population. It helps visualize inequality.
- It plots the cumulative percentage of total income or wealth earned by the cumulative percentage of the population, arranged from the poorest to the richest.
- X-axis → Cumulative percentage of population (from poorest to richest)
- Y-axis → Cumulative percentage of income or wealth
Types of Inequality Gini Measures:
- Consumption Gini (used by World Bank)
- Income Gini
- Wealth Gini
Key Issue: Gini coefficient for consumption is inherently lower than for income or wealth.
What is Consumption Inequality?
Consumption inequality refers to unequal distribution of consumption expenditure among individuals or households in an economy. It reflects how much people spend on goods and services (like food, education, healthcare, etc.), not how much they earn (income) or own (wealth).
Why It Understates Reality:
- Poor spend most of their income on necessities (food, rent).
- Rich can save/invest; their spending (consumption) doesn't rise proportionally with income.
Hence: Consumption inequality doesn’t reflect the true gap in incomes or wealth.
Limitations of Consumption Data
- Sources: HCES (Household Consumption Expenditure Surveys) 2011–12 & 2022–23.
- Problems:
- Undercounts high-income households.
- Methodological differences between the two surveys make comparisons unreliable.
- Even the official release cautions against direct comparisons.
Income and Wealth Inequality: The Real Picture
- Sources: World Inequality Database (WID) – uses tax data, national surveys, rich lists.
- Findings:
- Income Gini (pre-tax) in 2022–23 = 61 → Extremely high.
- Wealth Gini in 2022–23 = 75 → Very high concentration.
- Comparative Status:
- India ranks among the top unequal economies (Only ~48 countries have higher income inequality).
- Both income and wealth inequality have increased significantly.
- Economic growth disproportionately benefited the top earners.
Gini’s Blind Spots – Top 1% Problem
- Gini coefficient is aggregate, doesn’t show top-end concentration.
- WID Data: In 2022–23, top 1% owned 40% of India’s personal wealth.
- India ranks 5th globally in wealth concentration (after Uruguay, Eswatini, Russia, South Africa).
Why Consumption Inequality Fell (Despite Rising Income Inequality)
- As rich get richer, they save more; their consumption doesn't rise equally.
- The poor’s consumption increases as their incomes rise (marginal utility).
- Hence, consumption inequality can fall even if income & wealth gaps widen.
Mains Question:
- "Despite high GDP growth, India continues to witness rising income and wealth inequality. Critically examine the limitations of consumption-based inequality measures and suggest policy interventions to ensure inclusive growth." 250 Words 15 Marks